Track average load times by browser
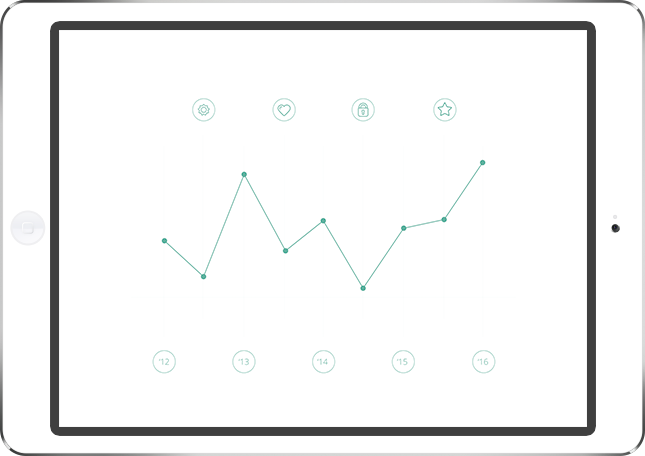
In the specific browsers, there is a possibility to track the average load times by the browser and by date to identify which browser performs well and which your site performs badly for. Average load time distribution for each page is visualized in a timeline showing the slowest, average and fastest load distribution speeds. You can view trends and if specific releases introduced an issue. Do you want to view a world view of how your site performs for each individual country and region? No problem. Also you can watch which countries are fastest and which are slowest and what the average load time is for all users.

Track average load times by platform
It is possible to define the average load times for all operating systems and platforms, as with browsers. Track the effects of visiting the top operating system that visitors use and identify how it influences on the site performance. Live view of recent requests, the user’s location, the pages they are viewing and even which of your individual users is on your site right now. Detailed timings for every page load, for every user and for every session. See overall performance for all users or find specific user sessions to see where they encountered an issue and what was the cause.

Feel the power of Departapp
Departapp offers a possibility to detect if load times are affected on desktop vs mobile, by the way it is possible to identify trend charts to spot spikes in abnormal behavior so you can see if a specific problem on one platform has been introduced. Crash reporting data brings a fresh perspective to existing real user monitoring products. See which users are experiencing errors and crashes in real time. View a breakdown of all visitor browsers and operating systems to see which are the most popular, which ones to optimize your site or bug fixes towards or if a certain browser experiences abnormal load speeds.